In agriculture, seeing a problem with your own eyes almost always means you are already late. When a leaf yellows, when growth stalls, when fruit fails to set, the crop has been compromised for days — sometimes weeks. The damage has happened; what you see is its consequence.
Satellite monitoring changes that equation. Not because it sees better than a trained eye, but because it sees something else: the plant’s physical signature before the symptom is visible.
The plant speaks in infrared
A nutrient deficiency alters crop physiology long before it shows up in color or shape. When nitrogen runs short, photosynthesis loses efficiency and the plant regulates its temperature and reflectance differently. That shift happens in bands of the spectrum the human eye cannot perceive — near-infrared and thermal — but which a satellite sensor records every day, over every square meter of your field.
Field evidence is consistent: a deficiency shows up as a rise in crop temperature at least a week before any physical change. That week is the difference between correcting in time and losing production.
From image to vigor index
A satellite photo, on its own, says nothing. What matters is how it is processed. From the spectral bands, vegetation indices are computed — the best known is NDVI — condensing plant vigor into a single number per ground cell.
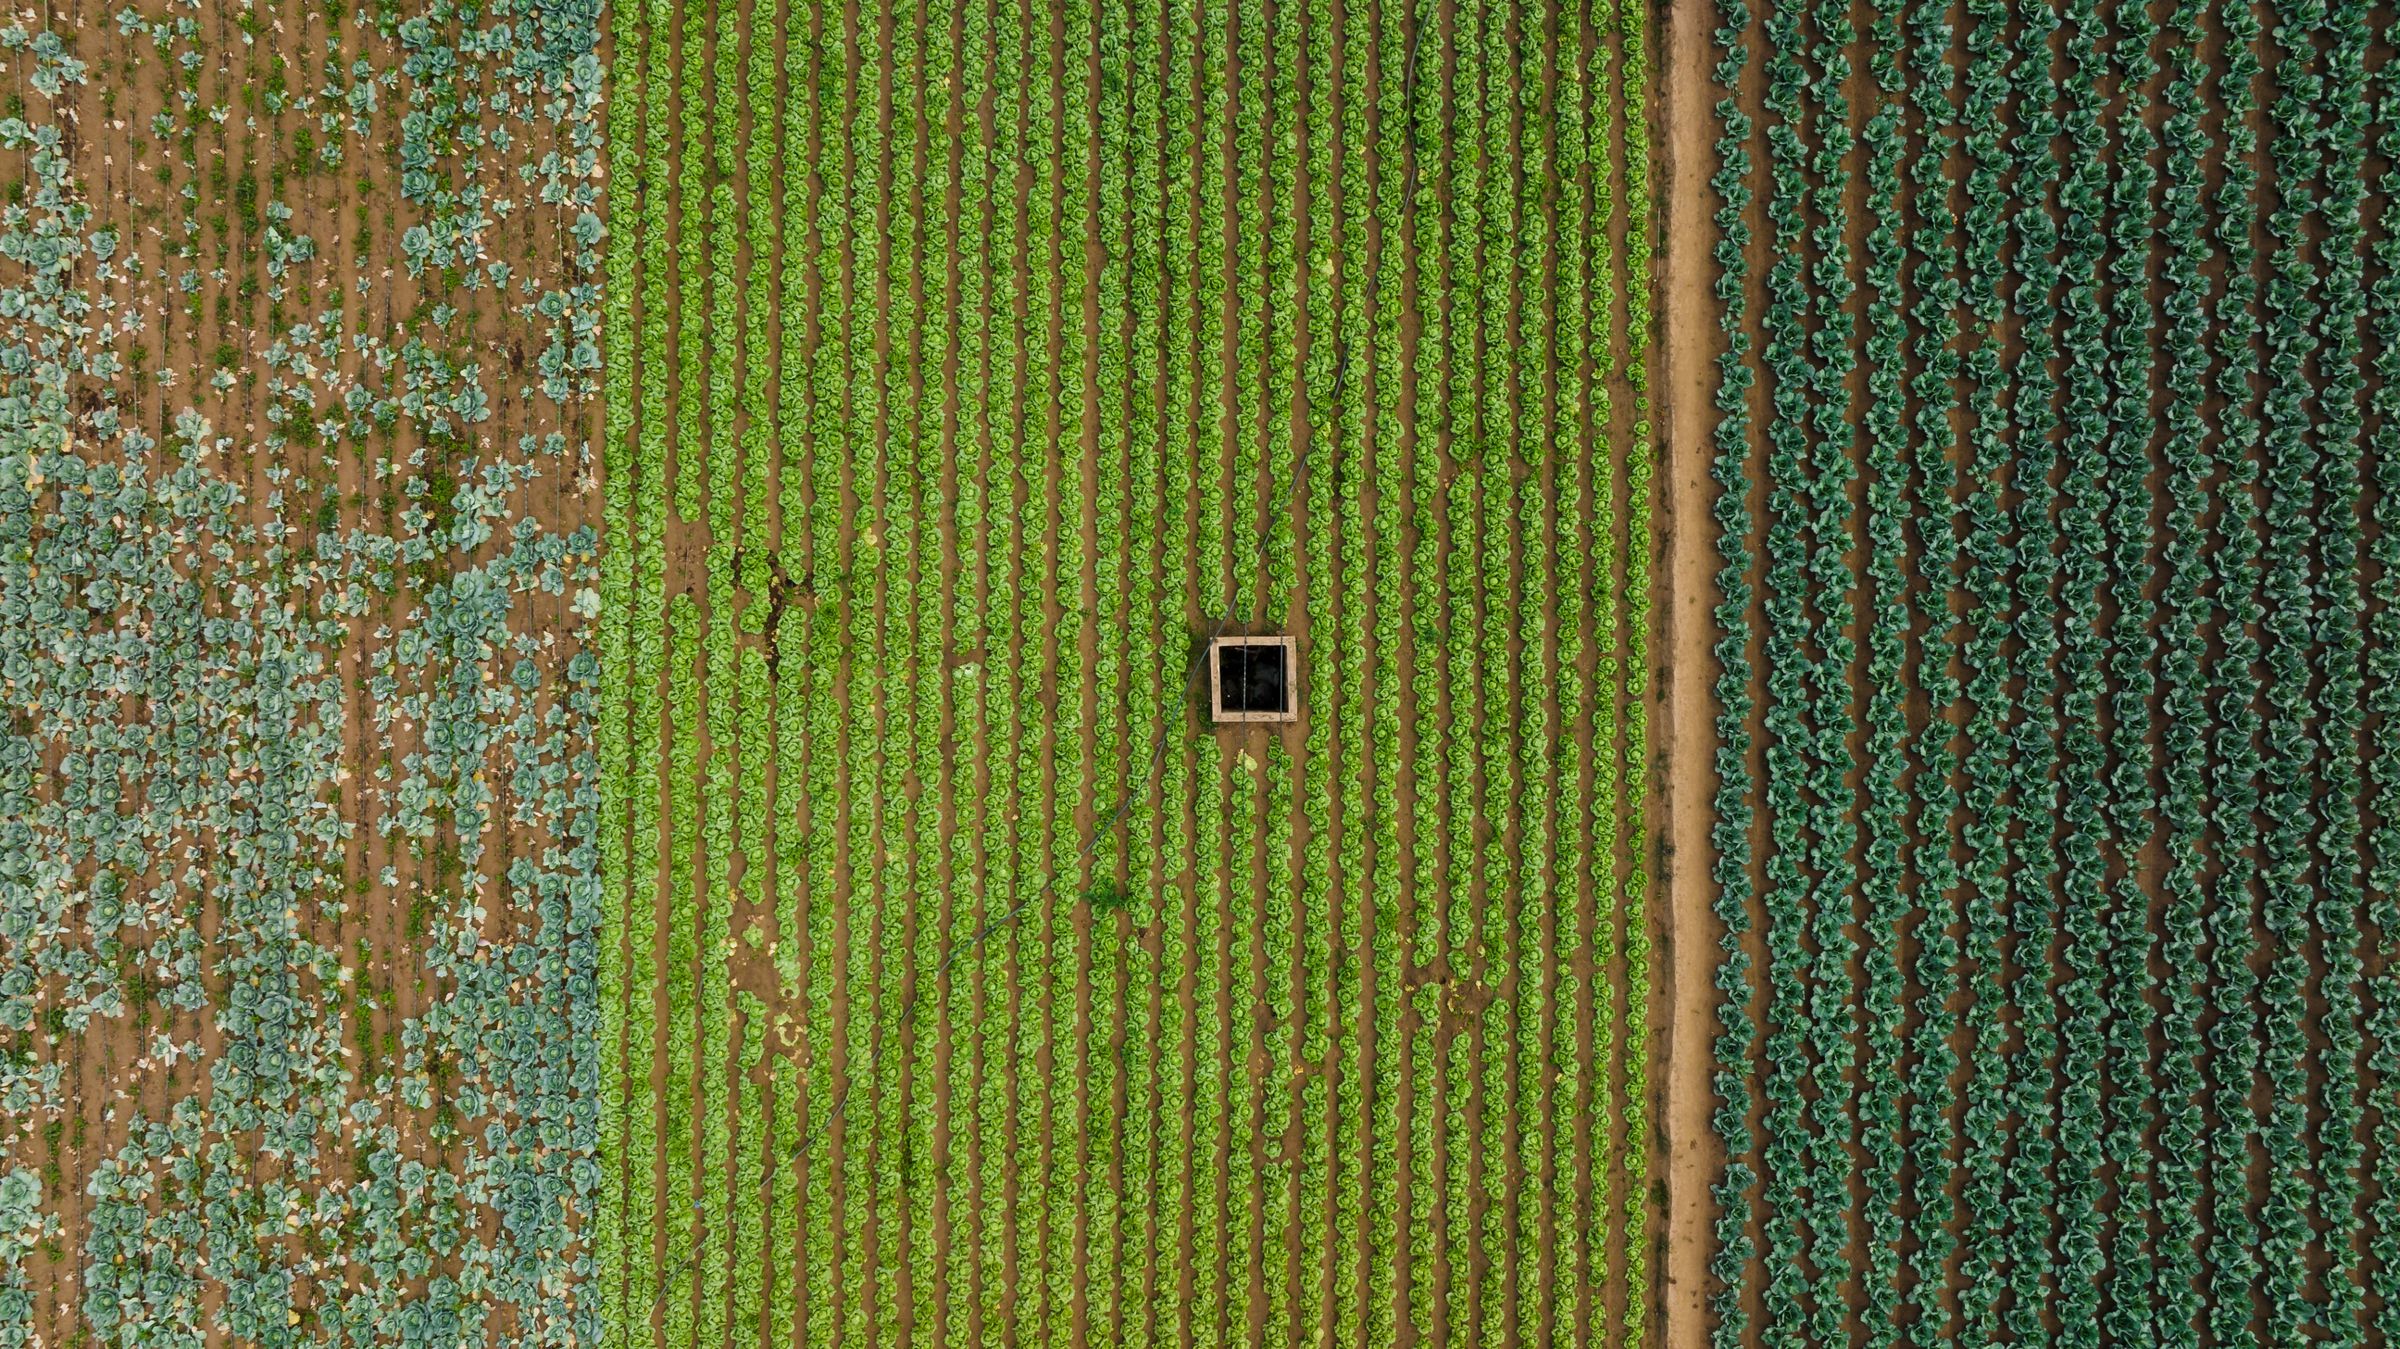
Mapping those indices across the field reveals something impossible to see from the ground: the internal variability of the block. Areas that thrive, areas that suffer, stress fronts on the move. A vigor map is not a pretty picture: it is a spatial diagnosis that tells you where to look and where to act.
Why the satellite alone isn’t enough
Here is the nuance many overlook: the satellite tells you that something is happening and where, but not always why. A low-vigor zone could be nitrogen shortage, water stress, a soil issue or an emerging pest. The signal is the same; the cause is not.
That is why satellite monitoring truly pays off when crossed with the field’s other signals:
- Soil analysis says which nutrients are present and in what balance.
- Sap analysis says what the plant is actually using today.
- Dendrometry measures growth and water stress continuously.
Each source, on its own, is a fragment. Together — fused by a model that learns from your crop — they stop being data and become a decision: what to apply, how much, and when.
From data to action
The value is not in the image. It is in the window of time it hands you. Detecting a deficiency a week early lets you intervene while it is still cheap to fix, instead of reacting once the yield is already gone.
Seeing the invisible isn’t a technological luxury. It is, quite simply, no longer arriving late.